How to Diagnose HTTP Status Codes, redirects, 404s etc
Last updated: 2026-09-24
Learn how to interpret HTTP status codes, handle redirects, and diagnose false negatives when using the Broken Link Manager.
Learn how to interpret and troubleshoot HTTP status codes displayed in the SharePoint Essentials Toolkit Broken Link Manager reports.
Understanding HTTP status codes
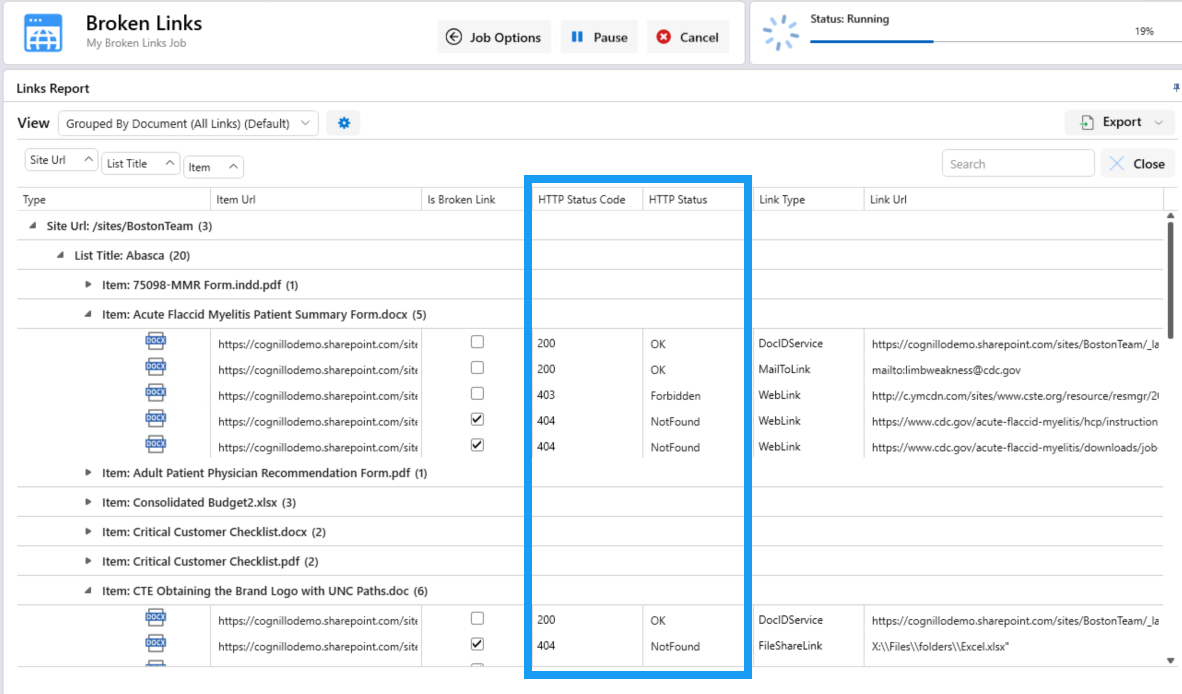
When reviewing Broken Link Manager reports, you will see various HTTP status codes alongside each link. These codes are returned directly by the web server hosting the target page (for example, Microsoft IIS or Apache) and follow the standard definitions outlined in RFC 2616.
Common examples include:
200 OK — The link resolved successfully.
301 / 302 Redirect — The link redirects to another URL.
401 Unauthorized — The tool does not have permission to access the page.
404 Not Found — The target page does not exist on the server.
Because these codes come from the destination server rather than from the toolkit itself, the values shown in the report reflect the actual server response at the time the link was checked.
The toolkit sends a lightweight GET request and reads only the HTTP response header. It does not load full page content, which keeps link checking fast and efficient.
How redirects are reported
Redirect behaviour can vary depending on how the destination server is configured. Some redirects are handled at the server level (returning a 301 or 302 status), while others occur after the page loads using client-side JavaScript.
The toolkit captures the initial HTTP response, so:
Server-side redirects (301/302) are detected and reported accurately.
Client-side redirects (JavaScript-based) may appear as a 200 OK, since the server responds successfully before the redirect occurs in the browser.
If you see unexpected redirect behaviour in your reports, check how the redirects are configured on your web server (for example, URL rewrite rules or .htaccess settings).
Troubleshooting unexpected status codes
If a status code in the report does not match what you expect, you can verify the server response using your browser's built-in developer tools.
Using Chrome DevTools
Open Google Chrome and navigate to the URL in question.
Press F12 to open Developer Tools.
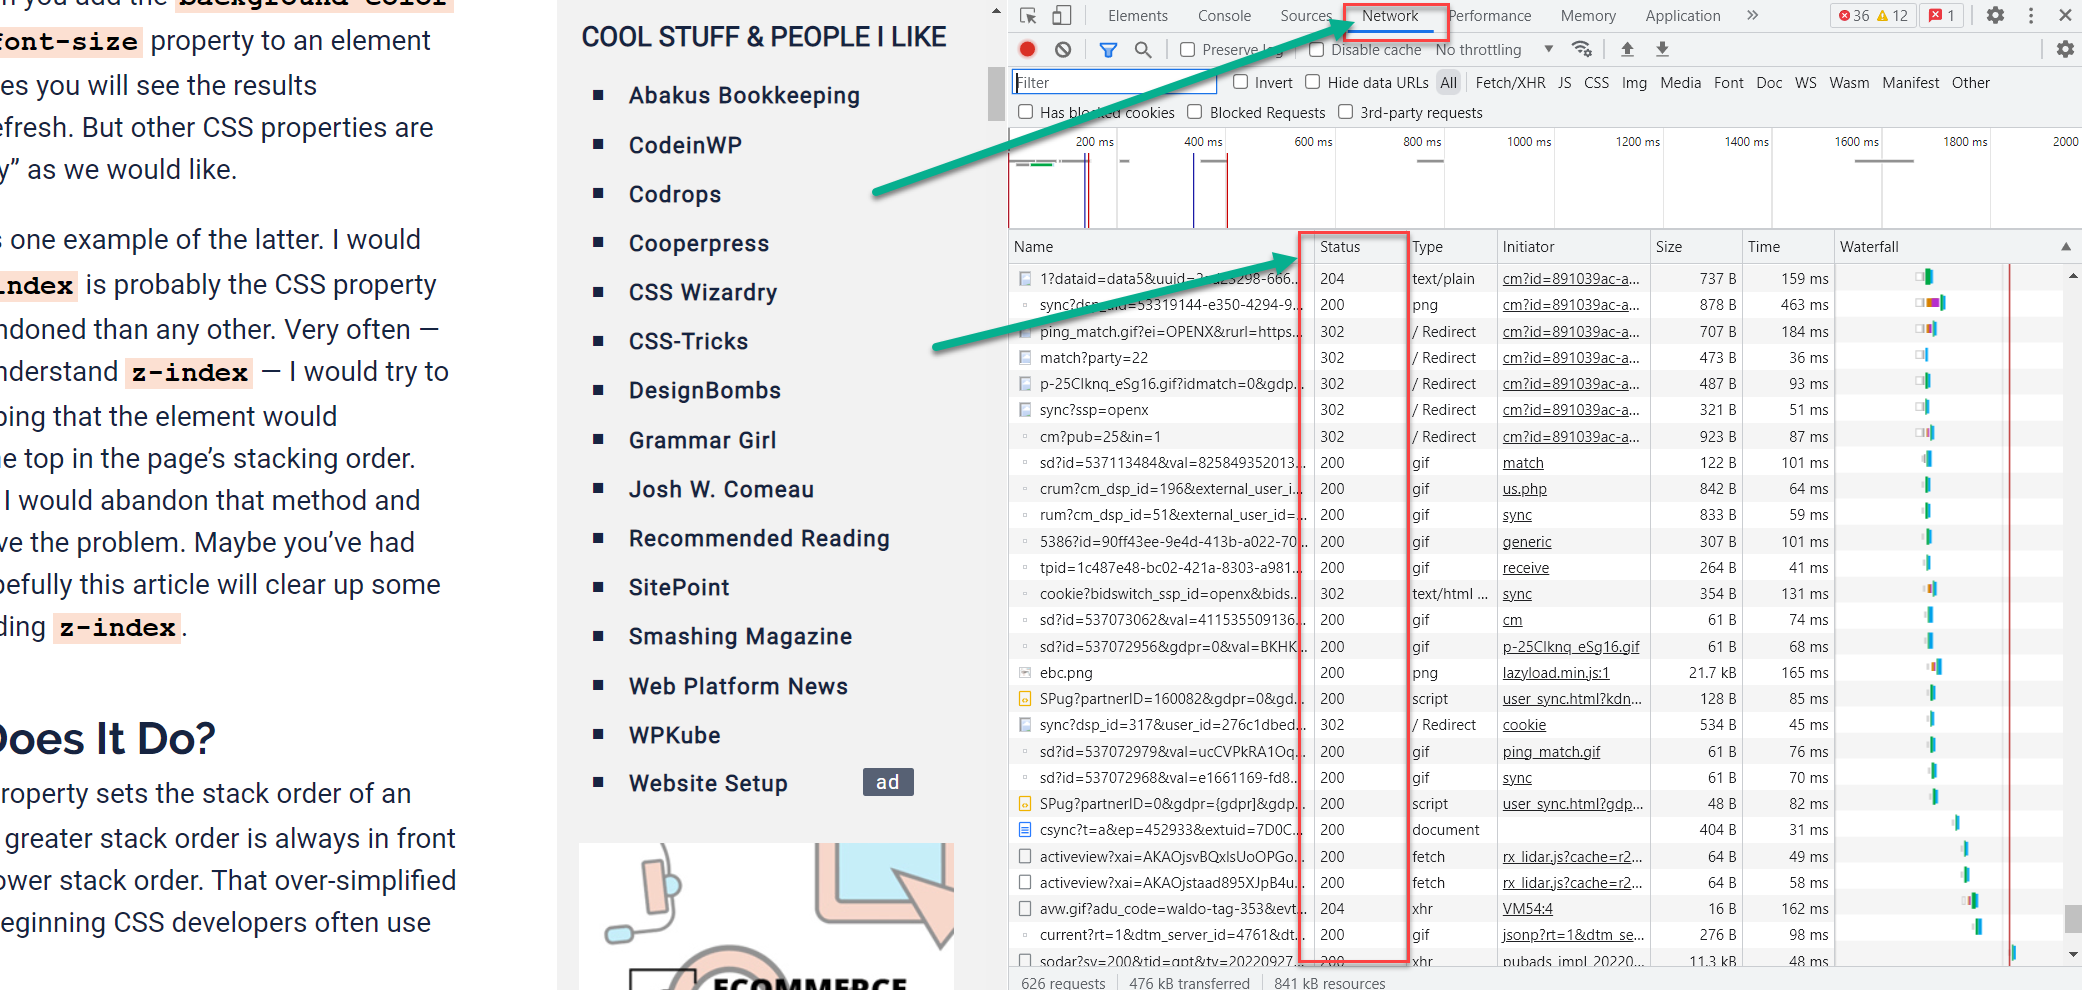
Select the Network tab.
Refresh the page or enter the URL in the address bar.
Review the network traffic to see the status codes returned by the server.
You can also use browser developer tools in Microsoft Edge or Firefox by pressing F12. The Network tab works similarly across all modern browsers.
The screenshot below shows an example of network traffic where different servers return different redirect responses for the same type of request: